
Why a rover's position gets worse the further it drives
A 0.1% difference in wheel diameter puts a differential-drive robot 0.17 m off after 10 m and 0.67 m off after 20 m. The maths behind odometry drift and the calibration that fixes most of it.
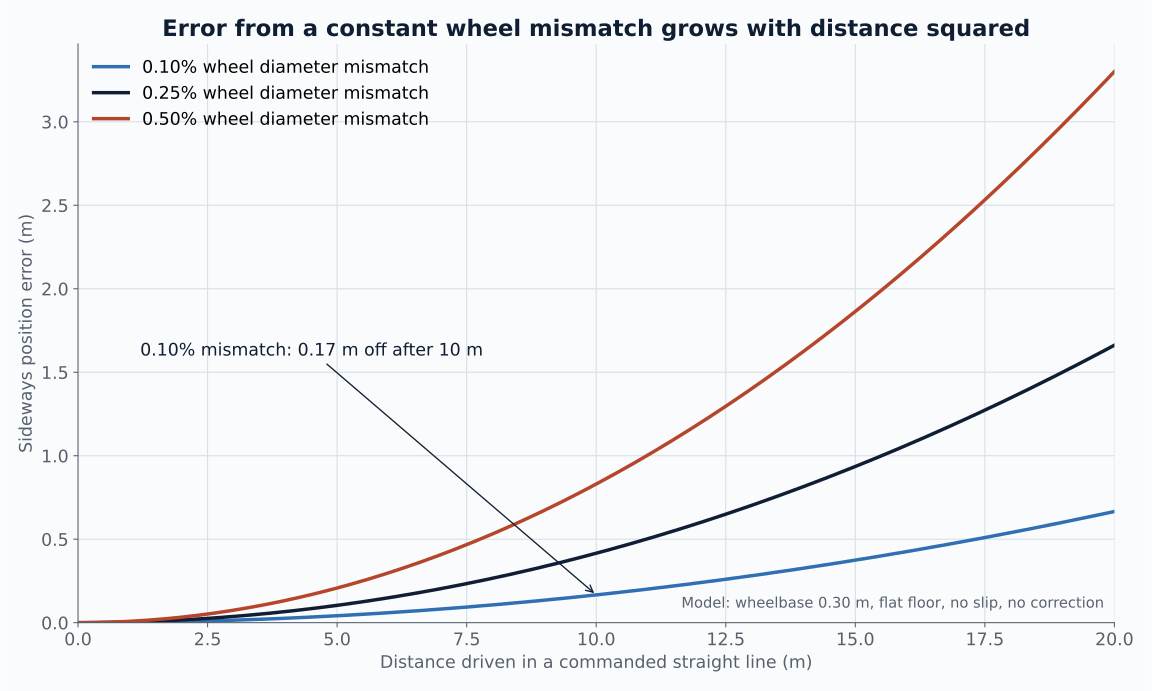
Wheel odometry is the first position estimate most mobile robots have. Count encoder ticks on each wheel, convert to distance, integrate. It is cheap, fast and available at every control cycle.
It also drifts, and the way it drifts is worth understanding before you decide how much to trust it. A small, constant error in the robot's geometry does not produce a small, constant position error. It produces one that grows with the square of the distance driven.
Two kinds of error
Borenstein and Feng separated odometry errors into two groups. Systematic errors come from the robot itself: unequal wheel diameters and an effective wheelbase that differs from the nominal value. Non-systematic errors come from the world: slip, bumps and uneven floors. [1]
Systematic errors are the interesting ones for a designer because they stay almost constant over long periods. That makes them measurable, and it makes them correctable in software.
Sources: [1]
Why the error grows with distance squared
Take a differential-drive robot with wheelbase b. If the right wheel is effectively a fraction e larger than the left, then while the robot believes it is driving straight, the right wheel covers slightly more ground. Over a distance ds the heading changes by e x ds / b.
That heading error accumulates linearly with distance. Sideways position error is the integral of the sine of the heading, so for small angles it accumulates as e x s squared / (2b). Double the distance and the sideways error roughly quadruples.
For a 0.30 m wheelbase and a 0.1% mismatch, the robot's heading has turned by 1.9 degrees after 10 m. The table shows the resulting sideways error, integrated numerically rather than with the small-angle shortcut.
| Wheel diameter mismatch | Sideways error at 5 m / 10 m / 20 m |
|---|---|
| 0.10% | 0.04 m / 0.17 m / 0.67 m |
| 0.25% | 0.10 m / 0.42 m / 1.66 m |
| 0.50% | 0.21 m / 0.83 m / 3.30 m |
A 0.1% difference on a 100 mm wheel is 0.1 mm. That is within normal manufacturing variation, tyre wear or uneven load on a soft tyre. It is not something you would see by looking at the robot.
Measuring it with a square path
The obvious test is to drive a square and see whether the robot ends up back at the start. The problem is that a wheel mismatch and a wheelbase error can cancel each other on a square driven in one direction, so a robot can pass that test while still being badly calibrated. [1]
UMBmark fixes this by driving a 4 m square five times clockwise and five times anticlockwise, then measuring where the robot actually stops each time. The two directions separate the error types, and the paper gives equations to turn the measured end positions into two correction factors: one for wheel diameter ratio and one for effective wheelbase. [1][2]
The authors reported at least an order of magnitude improvement in systematic odometric accuracy after applying the corrections. A tape measure and some floor tape are enough to run it. [1]
What this means for a navigation stack
Odometry is still useful. Over short distances, between laser scans or camera frames, it is smooth and fast, and that is what a localisation filter needs between absolute corrections. The quadratic growth is the reason it cannot be the only source.
In a ROS 2 stack the usual arrangement is wheel odometry and an IMU fused in an EKF for the continuous estimate, with LiDAR scan matching or visual landmarks correcting it at a lower rate. Calibrating systematic errors first means the filter is correcting noise rather than a steady bias, and the corrections it has to make get smaller.
Run the square-path test before tuning the filter. It is a morning's work, and it removes the error source that grows the fastest.
Sources and further reading
The drift figures are computed for a 0.30 m wheelbase on a flat floor with no slip. The model and script are linked above, so the numbers can be rerun with your own robot's geometry.